
Historical Weather Data & Climate Analytics for Global Decision-Making
40+ years of global historical weather data with powerful analytics and insights
for research, risk assessment, and decision making.
📂
40+yr
Archive Coverage
🌍
200+
Countries Included
📊
500M+
Daily Records
🧮
50+
Derived Indices
99.2%
Data Completeness
Why CustomWeather Historical Data?
Visualize 40-year temperature trends, precipitation patterns, and extreme events at any location worldwide — or drill down to hourly granularity.
- Coverage: 8,500+ global stations
- Depth: 40+ years of historical coverage
- Data: Hourly, daily, monthly + forecast archives
- Formats: API + GIS-ready formats

1
Train better AI models with high-resolution reanalysis datasets (ERA5, CFSR)
2
Reduce risk exposure with long-term climate trends
3
Improve forecasting accuracy using historical + forecast datasets
4
Eliminate heavy downloads with point-based API delivery
5
Hyper-local resolution down to 100m (forecasts)
6
Combines station + satellite + model data
7
No need to download massive datasets (point delivery)
8
Custom modeling + analytics available
Global Historical Weather Data: Built for Data-Driven Industries
Hourly, daily, monthly climate data • Up to 40+ years of history • 8,500+ locations worldwide

Energy & Renewables
- Optimize solar/wind output
- Analyze irradiance, precipitation, temperature trends

Insurance & Risk
- Historical storm, precipitation, and extreme event modeling

Agriculture
- Growing degree days, precipitation patterns, soil moisture

AI/Machine Learning
- Train models using ERA5, satellite precipitation, and forecast archives
Query Builder
Custom Analytics in Minutes
Build exactly what you need: location, date range, variables, aggregation level, and
derived metrics.
Custom Dataset Builder
Export & Delivery
Pre-Built Reports
Real-World Applications
40 Years of Decisions
From climate research to insurance underwriting — historical weather data drives
critical decisions across every industry.
🛡️
Insurance & Reinsurance
Historical event attribution, loss modeling, CAT model inputs, and climate change risk adjustment for underwriting.
CAT modeling
Loss history
Climate trends
🌱
Agriculture Planning
Frost risk analysis, growing season metrics, drought history, and yield correlation studies for crop management.
Frost dates
GDD analysis
Drought trends
⚡
Energy Forecasting
Historical demand correlation, wind/solar resource assessment, extreme event preparedness, and grid planning.
Demand patterns
Wind resources
Peak analysis
📚
Climate Research
Climate variability studies, trend analysis, seasonal prediction validation, and climate model evaluation.
Trend analysis
Climate models
Validation
⚖️
Forensic Meteorology
Event reconstruction, expert witness support, property damage assessment, and legal liability determination.
Event analysis
Reconstruction
Documentation
🏗️
Infrastructure Planning
Extreme event planning, climate adaptation, asset risk assessment, and long-term operational planning.
Extreme analysis
Risk maps
Resilience
Research-Grade Data
Every record is audited, gap-filled, and cross-verified against primary sources. Climate researchers, insurers, and government agencies trust
our 40-year archive.
Coverage
Geographic and temporal coverage of daily records worldwide
Completeness
No missing values after quality control and gap-filling
Verification
All records cross-checked against multiple sources and networks
QUALITY ASSURANCE METHODOLOGY
🔍
Outlier Detection
Automated flagging of statistical anomalies
🔗
Cross-Network Verification
Validation against multiple independent sources
📊
Homogeneity Testing
Breakpoint detection for station moves/instrument changes
🧬
Gap-Filling
Spatial interpolation and machine learning for missing values
DATA SOURCE NETWORK
NOAA GHCN
160K+
NOAA ISD
30K+
ECMWF ERA5
50km grid
Regional Networks
500K+
Primary sources include NOAA Global Historical Climatology Network, ECMWF reanalysis, national meteorological agencies, and local observation networks.
Certifications & Compliance
ISO 27001
Information security
SOC 2 Type II
Data integrity & access controls
GDPR
Data privacy compliant
WMO Standards
Climate data best practices
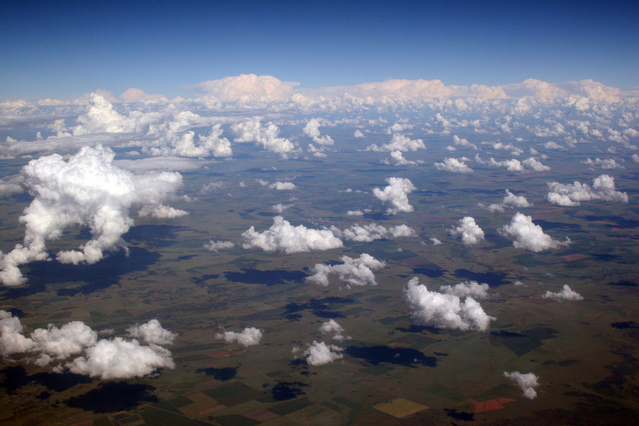
Hourly, Daily and Monthly Observations
- Temperature, humidity, wind, pressure
- Precipitation & sky conditions
- Degree days, visibility, sunshine
Hourly Climate Data - Detailed Information
CustomWeather’s Hourly Climate Information offers a comprehensive database of hourly climate information for over 8,500 locations worldwide. Normalized values can be delivered for various time periods.
Hourly climate information includes:
daylight status
sky descriptor
precipitation descriptor
temperature
wind speed
wind direction
wind gusts
humidity
dew point
barometric tendency
sea level pressure
sky conditions
precipitation totals for various time periods
Daily Climate Data - Detailed Information
Daily Climate Data – Detailed Information
CustomWeather offers a comprehensive database of daily climate information for over 8,500 locations worldwide. Daily climate records go as far back as the late 1800s for a few locations, and our standard product sets include 10, 20 or 30 years of historical data. Normalized values can be delivered across each of these periods.
Daily climate information includes:
- station ID
- valid date time
- maximum temperature
- minimum temperature
- average temperature
- heating degree days
- cooling degree days
- precipitation
- average relative humidity
- average dew point
- average wind speed
- average visibility
- average sea level pressure
- actual sunshine hours
- average possible sunshine hours
Monthly Climate Data - Detailed Information
CustomWeather’s Historical Climate Data features a monthly summary of weather conditions for over 1800 locations worldwide.
Monthly summary includes:
- average morning relative humidity
- average afternoon humidity
- typical sky cover
- days with precipitation
- days with fog
- days with snow
- average high
- average low
- average mean temperature
- average dew point
- average wind speed
- average wind direction
- days below freezing
- days above 90F/32.2C
- record high temperature
- record low temperature
- record wind speed
- record monthly snowfall

Satellite & Radar-Derived Data
- CMORPH global precipitation (since 1998)
- MRMS high-resolution U.S. rainfall data
CMORPH Data - Detailed Information
Several different SDPs are available. Data is precipitation-focused, with precipitation type available. Data available as GEOTIFF, netCDF, and CSV. Higher resolution available for CONUS (1 Km). Data derived from a suite of satellites is then dynamically down scaled within GIS.
CMORPH
Satellite-derived, global historical precipitation data at 8-km resolution back to 1998 in hourly and daily time steps.
- CMORPH Hourly Obs
- CMORPH Hourly 20-YR Climate 2001-2020
- CMORPH Hourly 20-YR Climate Rolling
- CMORPH Hourly 10-HR Climate Rolling
- CMORPH Hourly 20-YR DEPARTURES base: 2001-2020
- CMORPH Hourly 20-YR ROLLING DEPARTURES
- CMORPH Hourly 10-YR ROLLING DEPARTURES
- CMORPH Daily Obs
MRMS (Multi Radar Multi Sensor) Rainfall Data for U.S.A. - Detailed Information
Several different SDPs are available. Data is precipitation-focused, with precipitation type available. Data available as GEOTIFF, netCDF, and CSV. Higher resolution available for CONUS (1 Km). Data derived from a suite of satellites is then dynamically down scaled within GIS.
MRMS (Multi Radar Multi Sensor) Rainfall Data for U.S.A.
- provides precipitation rates and totals
- available in 15 minute, hourly and daily increments
- includes data from 2021 – present.

Gridded Climate & Reanalysis
- ERA5 / ERA5-Land (9km resolution)
- CFSR, NLDAS, SMAP datasets
- Ideal for AI + climate modeling
ERA5 – ECMWF Reanalysis Version 5 - Detailed Information
ERA5 – ECMWF Reanalysis Version 5: A key dataset for machine learning applications, the ERA5 is also critical to the study of specific historical events, low-frequency variability and extremes in climate studies.
ECMWF Reanalysis 5th Generation (ERA5-Land ): Data dating back to 2011 at 9-km resolution, including historical averages (daily).
- Surface Precipitation
- 2m Dewpoint Temperature
- Surface Net Radiation
- 2m Relative Humidity
- Surface Snowfall (Water Equivalent Depth)
- Surface Downward Solar Radiation
- 2m Temperature
- 10m U-Component of Win
- 10m V-Component of Wind
25-km ERA5: Satellite-derived, global non-precipitation variables (40) at 25-km resolution back to 1980.
- ERA Hourly Obs
- ERA Hourly 30-YR Climate 1991-2010
- ERA Hourly 30-YR Climate Rolling
- ERA Hourly 10-HR Climate Rolling
- ERA Hourly 30-YR DEPARTURES base: 1991-2010
- ERA Hourly 30-YR ROLLING DEPARTURES
- ERA Hourly 10-YR ROLLING DEPARTURE
CFSR - Detailed Information
CFSR is a global, high resolution, coupled atmosphere-ocean-land surface-sea ice system designed to provide the best estimate of the state of these coupled domains over this period. The CFSR includes coupling of atmosphere and ocean during the generation of the 6 hour guess field, an interactive sea-ice model, and assimilation of satellite radiances.
Data is available globally back to 1980 (hourly or daily, including averages)
SMAP - Detailed Information
Land data at 8km resolution (including soil moisture) from NASA. SMAP measurements provide direct sensing of soil moisture in the top 5 cm of the soil column everywhere on Earth. Soil moisture is a critical measurement for weather forecasting, drought and flood predictions, agriculture, and more.
NLDAS (North American Land Data Assimilation System) - Detailed Information
North American Land Data Assimilation System (NLDAS) offers quality-controlled, and spatially and temporally consistent, land-surface model (LSM) datasets from the best available observations and model output to support modeling activities.
- Currently running in near real-time on a 1/8th-degree grid over central North America
- Retrospective NLDAS datasets and simulations also extend back to January 1979
- Model outputs include surface fluxes, soil moisture, and snow cover
CustomWeather Estimator Grids - Detailed Information
Developed by CustomWeather, CW Estimator Grids provide a snapshot every 10 minutes (at 10km resolution worldwide) of the estimated
conditions at every point on Earth.
CW Estimator Grids are based on:
- A combination of every possible weather station reading (including over 30,000 MADIS readings)
- Satellite-estimated temperatures
- RTMA (Real-time Mesoscale Analysis) data
- Model analysis data from rapidly updating models
such as the High Resolution Rapid Refresh (HRRR) model
Our CW Estimator Grids provide data on all essential weather variables, including current conditions including temperature, humidity, dew point, wind speed/direction, and barometric pressure.
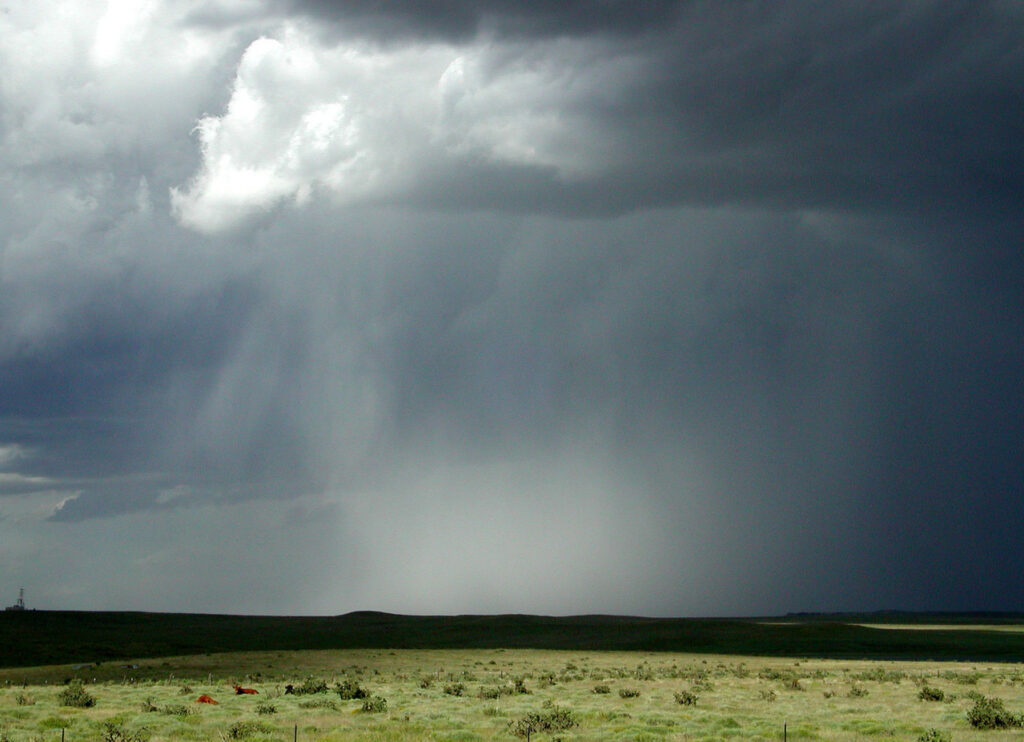
Historical Forecast Data
- Archive back to 2009
- 5-day, 7-day, hourly forecasts
- Includes probability, UV index, conditions
Historical Forecast Data - Detailed Information
CustomWeather’s Historical Forecast Data includes historical hourly and/or daily forecast data from 2009 until present date.
Data includes:
- condition descriptions
- high/low temperatures
- wind speed and direction
- humidity
- comfort level
- UV index
- expected
- probability of precipitation
- miles/km of visibility
Time periods available for each forecast:
- 5-day forecast: October 9, 2009 – Present
- 7-day hourly forecast: August 2, 2009 – Present,
- 48-hour detailed forecast: August 2, 2009 – Present
- 5-day detailed forecast: August 4, 2009 – Present
- 7-day CW100 forecast: December 6, 2010 – Present
Flexible Data Delivery and Easy Integration
- API (JSON / XML)
- CSV, netCDF, GeoTIFF
- FTP, HTTPS
- Point-based or full-grid access